Key facts
- Event attribution compares the world as it is (factual) with a model world without human warming (counterfactual) to ask how much likelier or stronger an event became.
- In 1990 the IPCC called such attribution virtually impossible. The first fraction-of-attributable-risk study, in 2004, examined the 2003 European heatwave.
- A Climate Central review of more than 600 studies found that 74% of the events and trends examined were made more likely or more severe, and about 9% less likely or less severe.
- Heatwaves are the best-modeled case. Droughts, snowstorms, tropical storms and wildfires are harder, and the 2010 Russian heatwave was made more likely but not more intense.

Every extreme event has natural causes, and every extreme event now occurs in a climate that humans have warmed. For decades that made it impossible to say anything about a single heatwave or flood. Event attribution is the branch of climate science that tries to say something anyway, by asking how the probability or intensity of an event differs between the real world and a world without human-caused warming. This note explains the method, summarizes what the large reviews found, and sets out where the answers are firm and where they are not. It belongs to the science notes on climate and weather.
From “virtually impossible” to routine
English Wikipedia’s article on extreme event attribution records how much the field changed. The first IPCC assessment, in 1990, called it virtually impossible to attribute individual events to climate change at that time. The first study to use the fraction of attributable risk method, a measure of how much of an event’s probability can be assigned to a cause, appeared in 2004 and analyzed the 2003 European heatwave. By 2016 an American Meteorological Society assessment reported that effects on some events could be detected with high confidence.
The 2003 heatwave still serves as the textbook case. English Wikipedia’s article on it describes the hottest summer in Europe since at least 1540 and reports more than 70,000 deaths, of which 14,802 were in France according to the French National Institute of Health.
How attribution works
The core idea is a comparison of two worlds. The factual world is the climate as observed, with human emissions. The counterfactual world is a climate as it would have been without them. Scientists build the two from observational records, from climate models, or from both. They then measure how often an event of a given size occurs in each.
Two choices shape the answer. The first is how the question is framed. The article stresses that “did humans cause this event?” is the wrong question, because weather has many causes, and that the studies ask instead whether the frequency or the intensity of an event changed. The second is speed. Otto has described studies completed within about two weeks of an event, while public interest is still high, and Copernicus announced in late 2025 an attribution office that would deliver two assessments a month, each within a week of an event.
What the reviews found
A November 2024 review by Climate Central, summarized in the same article, covered more than 600 studies and almost 750 events and trends.
| Result | Share of events and trends |
|---|---|
| Made more likely or more severe by climate change | 74% |
| Made less likely or less severe | about 9% |
The cited source does not break down the remaining share. The article also cites a Nature study finding that the median heatwave of the 2010s was about 200 times more likely because of human influence. These are statements about the events that researchers chose to study, not about every extreme event, so the shares describe the sample and not the whole climate.
Some answers are firmer than others
Heatwaves are the best-modeled case. The article states that droughts, snowstorms, tropical storms and wildfires are harder to model and therefore to attribute. Heavy rain falls in between: the article on extreme weather links it to rising atmospheric water vapor, and no precise rate is quoted here because the cited source does not give one.
Results can also be less simple than “more extreme.” The 2010 Russian heatwave was made more likely according to the article, but not more intense. Tropical cyclones show a mixed picture. The extreme weather article reports that the number of Category 5 storms per year has doubled since 1982, and that the number of billion-dollar Atlantic hurricanes has nearly doubled since the 1980s, partly because of coastal development. It also cites a 2020 NOAA assessment projecting that Atlantic hurricane frequency will fall by about 25 percent and maximum intensity rise by about 5 percent over the 21st century. Frequency and intensity can move in different directions.
For the highest warming levels the IPCC’s sixth assessment, as reported there, projects more than 5 °C more extreme heat at 4 °C of global warming. The link between that figure and the sensitivity of the climate to CO2 is explained in climate sensitivity.
Reading a headline
A few habits help when an attribution result appears in the news:
- Check which quantity is reported, frequency, intensity or both.
- Check the baseline, since “twice as likely” depends on the comparison world.
- Remember that damage depends on exposure as well as weather, which the hurricane figure above makes explicit.
- Treat a rapid study as an estimate that may be refined later.
The statistical side of rare events matters too. How a probability such as 1 percent per year translates into repeated events is explained in what a 100-year flood really means.
What this note leaves out
This note does not describe the model ensembles and statistical tests used in individual studies, nor does it rank the methods of particular research groups. It does not quote a rate at which rainfall increases with temperature, since the sources cited give none. It does not discuss the 2025 Copernicus office beyond what the article states. Figures from Wikipedia reflect its summaries of the primary literature, which should be read for any decision that depends on a number.
What remains open
Attribution is strongest where the physics is simple and data are plentiful, and weakest for events driven by circulation patterns and local processes. The fraction of studied events that were made worse is a fair summary of the sample, but not of every extreme. The sources cited do not say how quickly the harder cases will be resolved.
About the image
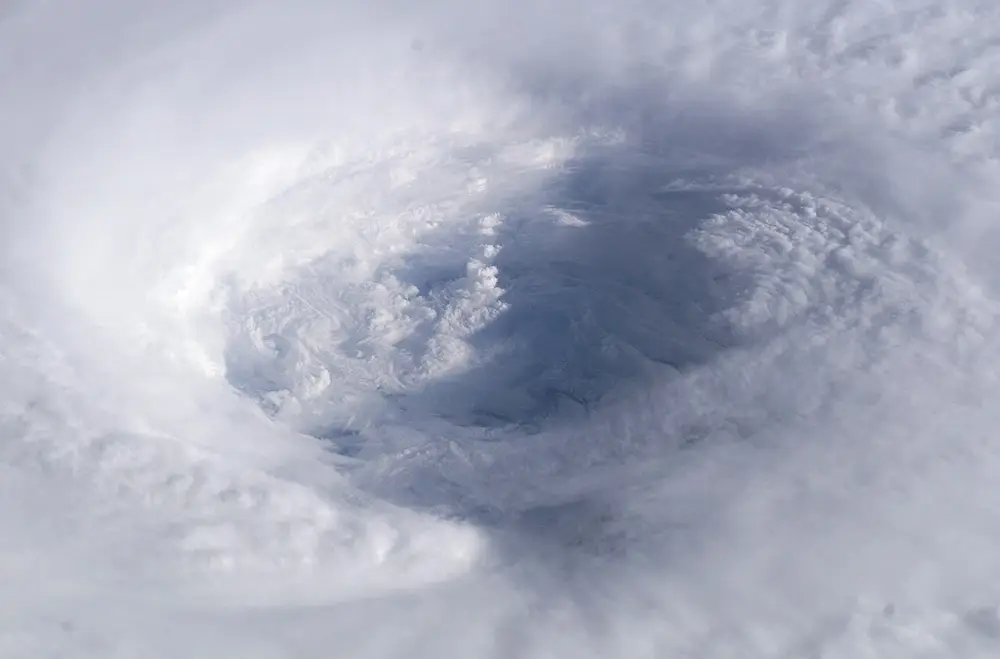
The image is a photograph of the eye of Hurricane Isabel taken from the International Space Station by NASA astronaut Ed Lu at 11:18 UTC on September 13, 2003. It is a US government work in the public domain. It stands for the tropical cyclone, one of the extreme event types for which attribution is harder than for heatwaves.
Frequently asked questions
Can scientists say that climate change caused a particular storm?
Attribution studies avoid that framing. They usually ask whether the frequency or intensity of an event changed, for example how many times more likely a heatwave became, rather than whether humans caused it.
How fast can an attribution study be done?
Friederike Otto, a leading researcher in the field, has described analyses completed within about two weeks of an event. Copernicus announced an attribution office in late 2025 aiming for two assessments a month, each within a week.
Which kinds of extremes are best understood?
Heatwaves. According to the Wikipedia article on event attribution, droughts, snowstorms, tropical storms and wildfires are harder to model and attribute.
Are hurricanes getting more frequent?
Not clearly. A 2020 NOAA assessment cited on Wikipedia projects that Atlantic hurricane frequency will fall by about 25 percent over the 21st century while maximum intensity rises by about 5 percent.
Sources and open data
- 2003 European heat wave, English Wikipedia
- Extreme event attribution, English Wikipedia
- Extreme weather, English Wikipedia