Key facts
- A 100-year flood has a 1% chance of being equaled or exceeded in any given year. It says nothing about when the last one happened.
- The chance of at least one such flood is 26% over a 30-year mortgage and 63.4% over 100 years, from the formula Pe = 1 - (1 - 1/T)^n.
- On the Danube at Passau, the gaps between 100-year floods between 1501 and 2013 ranged from 37 to 192 years.
- Estimates rest on short gauge records, and maps generally reflect the 20th-century climate, so they may understate present risk.

A “100-year flood” is one of the most misunderstood phrases in weather reporting. It is a statement of probability: in any given year, the chance that a river or coast reaches a certain level or higher is 1 in 100. It is not a schedule, and it does not promise that a century will pass between events. This note explains how the number is built, how the odds accumulate over the length of a mortgage or a human life, and why the estimate is shakier than the tidy label suggests. It belongs to the science notes on climate and weather.
The definition
Hydrologists describe floods by their return period, also called recurrence interval. A 100-year flood has a recurrence interval of 100 years, which is the same as an annual exceedance probability of 1 percent. English Wikipedia’s article on the term states the probability plainly: each year has a 1 percent chance of a flood that size or larger, and the chance in the next year does not depend on whether one occurred in the last.
The same logic applies to other levels. A 10-year flood has a 10 percent annual chance, and a 500-year flood has a 0.2 percent annual chance. The article notes that the US Federal Emergency Management Agency maps both the 100-year and the 500-year floodplains. In England, the “High Probability” category, Flood Zone 3a, covers land with at least a 1 percent annual chance of river flooding or 0.5 percent from the sea.
The US Geological Survey (USGS) goes further and says hydrologists prefer “recurrence interval” over “100-year flood”, calling the common phrase a misinterpretation. The recurrence interval, in its words, is based on the probability that the given event will be equaled or exceeded in any given year. The agency also favors the term annual exceedance probability (AEP), which expresses the chance as a fraction of one: a 0.2 AEP flood has a 20 percent chance of occurring in any year. Its wording is that AEP “reminds the observer that a rare flood does not reduce the chances of another rare flood within a short time period.”
One more distinction matters for news stories. A 100-year storm is not necessarily a 100-year flood, since flooding also depends on terrain and the shape of the river. The article adds that a flood affecting two branches of a river can have a different recurrence interval downstream, and that news reports tend to quote the largest interval estimated at any single location.
Return period and probability side by side
The USGS publishes a conversion table that makes the relation easy to read. The annual chance is simply 100 divided by the return period in years.
| Recurrence interval (years) | Annual exceedance probability |
|---|---|
| 2 | 50% |
| 5 | 20% |
| 10 | 10% |
| 25 | 4% |
| 50 | 2% |
| 100 | 1% |
| 200 | 0.5% |
| 500 | 0.2% |
NOAA applies the same idea to rainfall. Its National Weather Service glossary, written for the NOAA Atlas 14 precipitation frequency estimates, defines the annual exceedance probability as the probability of exceeding a given amount in any given year, once or more than once. It adds that the inverse of AEP measures the average time between years, “and not events,” in which a value is exceeded at least once. A rainfall figure is also tied to a duration, so a 100-year rainfall for one hour is a different quantity from a 100-year rainfall for 24 hours.
How the odds add up
Because each year is a fresh draw, the chance of at least one 100-year flood grows with the time window. The article gives the formula Pe = 1 - (1 - 1/T)^n, where T is the return period in years and n is the number of years considered. For T = 100 the results it reports are:
| Time window | Chance of at least one 100-year flood |
|---|---|
| 1 year | 1% |
| 10 years | about 10% |
| 30 years (a typical mortgage) | 26% |
| 80 years (a lifetime) | 55% |
| 100 years | 63.4% |
The last row is the one that surprises people. After a full century at a single location, there is still a 36.6 percent chance of seeing none. The article puts the same result another way: over 100 years at one spot, roughly 37 percent of cases contain no such flood, 37 percent contain exactly one and 26 percent contain two or more.
The formula also explains why the label misleads. A homeowner told that a property is outside the 100-year floodplain may hear “safe.” The property may simply sit in a 500-year zone, where the same formula gives a chance of about 6 percent over 30 years (a calculation made for this note from the expression above, not a figure quoted from the source). Low is not zero.
Gaps are irregular
The USGS makes the same point with a thought experiment: in 1,000 years of data one would expect about 10 floods of equal or greater size than the 100-year flood, but the gaps between them could be 15 years or fewer in some stretches and 150 years or more in others. For a 30-year mortgage, it states that a home in the 100-year floodplain has a 26 percent chance of being flooded at least once, which matches the formula above.
If floods followed a calendar, intervals between them would be near 100 years. They do not. The article cites the Danube at Passau, where records stretch from 1501 to 2013, and reports that the intervals between 100-year floods ranged from 37 to 192 years. Two events within a few decades and a pause of nearly two centuries are both consistent with a constant 1 percent annual chance.
The article also gives a sense of scale. Roughly 1 percent of watersheds in a given year experience a 100-year flood or a larger one. That is a statement about many rivers at once, which is why a headline about a 100-year flood somewhere is not remarkable in itself.
Where the numbers come from
A return period is an estimate fitted to a record of past floods, and it is only as good as the record. The USGS explains that the level is computed statistically, through frequency analysis of past data, so it changes as new data arrive or as a basin is altered. It states that ten or more years of data are needed to perform a frequency analysis, and that a hydrologist has more confidence in a river with 30 years of record than in one with 10. The article reports that in the United States, gauge records of at least 60 years exist at fewer than 2,600 locations, records of 90 years at fewer than 500 locations, and records of 120 years at only 11. Estimating a 100-year level from a shorter record means extrapolating beyond the data, and the uncertainty grows with the extrapolation.
Coastal flooding relies on tide gauges, and the article says there are about 1,450 sites worldwide. Protection standards differ by country. The article notes that the Netherlands designs for floods of up to 10,000 years, and that the United Kingdom mapped 1,000-year floods after the North Sea flood of 1953. A 100-year standard is therefore a policy choice rather than a law of nature.
In the United States the 1 percent level became the benchmark for the National Flood Insurance Program, which began in the 1960s. The article notes that about 3 percent of the US population lives in the 1 percent coastal flood hazard zone. The standard decides who must buy flood insurance and where building is restricted, which is why a line on a map can carry so much weight.
A moving target
The statistics assume that the past is a fair guide to the future. The article states that flood maps generally represent the 20th-century climate and may therefore underestimate the effect of climate change. If heavy rain becomes more frequent, a flood once rated at 1 percent would in reality be more likely than that, while the label on the map stays the same until it is redrawn. For how scientists assess whether a particular event was made more likely, see how climate change influences extreme weather.
What this note leaves out
This note does not give flood risk for any particular place, which needs a current local map and an engineering assessment. It does not describe the statistical methods in detail, such as fitting extreme-value distributions. It quotes no figures for how climate change alters river flow, and it does not cover flash floods, storm surge or the economics of flood insurance beyond the points above. The Wikipedia figures on record lengths, tide gauges and national standards should be confirmed with the national agencies, including FEMA in the United States, before being used for decisions.
What remains open
The central difficulty is that a 1-in-100 event is by construction rarely observed, so the estimate always leans on a short record, a statistical model and a judgment about whether the past still applies. The practical advice that follows from the numbers is modest. Treat the 1 percent line as a prompt for awareness rather than a boundary of safety, and check the date of the map.
About the image
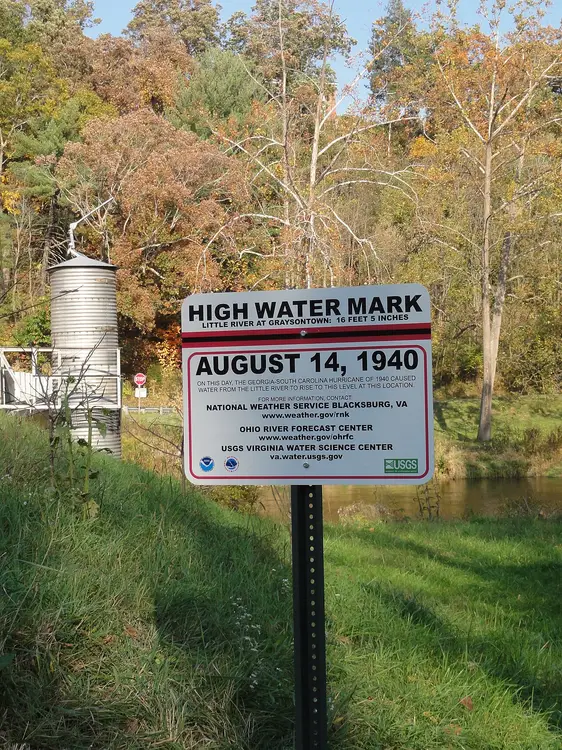
The image shows a high water mark sign installed by the National Weather Service and the US Geological Survey along the Little River at Snowville in Pulaski County, Virginia. Its description notes that the USGS stream gauge is visible in the background. Signs like this record how high past floods reached and give the gauge records discussed above a visible, local reference.
Frequently asked questions
Does a 100-year flood happen once every 100 years?
No. The name describes a long-run average. Each year carries a 1 percent chance, and two such floods can occur in consecutive years. Over 100 years at one spot, about 37 percent of cases see none, 37 percent see exactly one and 26 percent see two or more.
If a 100-year flood just happened, am I safe for decades?
No. The probability resets every year, because the weather of one year does not use up the allowance of the next. The same 1 percent applies the following year.
Is a 100-year storm the same as a 100-year flood?
Not necessarily. A flood depends on rainfall but also on terrain and the shape of the river, so a 100-year rainstorm does not always produce a 100-year flood.
Why do flood maps change?
Records grow and the climate shifts. Flood maps generally represent the 20th-century climate and may underestimate the effect of climate change, so they need to be redrawn.
Why do hydrologists prefer "annual exceedance probability"?
The USGS notes that the term reminds readers that a rare flood does not lower the chance of another rare flood soon after. A 1 percent AEP flood says only that each year carries a 1 percent chance.
Sources and open data
- 100-year flood, English Wikipedia
- The 100-year flood, US Geological Survey, Water Science School
- Floods and recurrence intervals, US Geological Survey, Water Science School
- HDSC glossary (annual exceedance probability, average recurrence interval), NOAA National Weather Service, Office of Water Prediction