Key facts
- The congestion charge began on 17 February 2003 and stood at £15 in 2025, rising to £18 from 2 January 2026.
- A 2006 Transport for London report counted 30% fewer chargeable vehicles entering the zone, and in the first year roughly 60,000 fewer vehicles, with 50 to 60 percent of the trips moving to public transport.
- The Ultra Low Emission Zone expanded to all 32 boroughs on 29 August 2023, covering over 1,500 square kilometers and about 9 million people.
- A 2025 report found NO2 27% lower across London in 2024 than it would have been without the zone, and 54% lower in central London.

London has spent two decades charging drivers for the privilege of entering its center, and then for the privilege of driving polluting vehicles anywhere in the city. Critics call this a war on cars. For Americans, the interest lies in the measured results and in the limits of the evidence. This note summarizes the congestion charge and the Ultra Low Emission Zone (ULEZ), using the figures in English Wikipedia’s articles on both, checked where possible against Transport for London (TfL) and Greater London Authority (GLA) primary documents: TfL’s sixth annual impacts monitoring report (2008) and two GLA releases on the ULEZ. It belongs to the science notes.
The congestion charge
The congestion charge started on 17 February 2003, inspired by the example of Singapore. A driver entering the central zone during charging hours pays a daily fee, which was £15 as of 2025 and £18 from 2 January 2026. The zone is home to about 136,000 residents. A western extension operated between 2007 and 2011.
The early results were published by TfL. Wikipedia reports a 2006 TfL report finding that chargeable vehicles entering the zone were down 30 percent. For the first year it cites roughly 60,000 fewer vehicles, of which 50 to 60 percent of the trips moved to public transport, and journey times down 14 percent.
The long-run picture is less clear. Traffic volumes fell by 10 percent, and vehicle-kilometers fell by 11 percent between 2000 and 2012. Wikipedia attaches a caution that this does not prove causation. It also notes that speeds have kept falling since the early gains. A reader should treat the charge as having produced a sharp early drop, rather than a permanent solution to congestion.
What TfL’s own monitoring found
TfL published a yearly impacts monitoring report on the scheme. The sixth, dated July 2008, is the most candid on the long run. It records that the standard daily charge rose from £5 to £8 in July 2005 and that a western extension began on 19 February 2007, with charging hours trimmed by 30 minutes to 07:00 to 18:00.
On congestion, the report is blunt. Congestion charging delivered decongestion in 2003, 2004 and 2005 in line with TfL’s expected reductions of 20 to 30 percent, but average congestion in the original zone in 2006 was only 8 percent below the pre-charge level. In 2007 the absolute level was, in TfL’s words, effectively identical to the representative value for 2002, so journey times inside the zone were comparable to those before charging. The report notes this happened despite traffic levels remaining broadly stable, which TfL read as pointing to changes in effective network capacity, with roadworks and traffic signal changes examined as likely contributors. It adds that road users could still be seen as better off than in a world without the charge.
| Indicator (TfL, sixth report) | Finding |
|---|---|
| Traffic entering the western extension, 2007 | Down 14 percent against 2005/06, about 195,000 vehicles with four or more wheels on a typical weekday |
| Cars, including minicabs, entering the extension | Down 21 percent |
| Vans entering the extension | Down 6 percent |
| Congestion in the original zone | 30 percent lower in the early years, level with 2002 by 2007 |
| Extra collisions avoided (earlier reports) | An estimated 40 to 70 injury collisions a year |
| Emissions attributed to the scheme (earlier reports) | NOx down 8 percent, PM10 down 7 percent, CO2 down 16 percent inside the original zone |
The report also states that charging was responsible for up to one-half of the bus patronage increase seen over 2002 to 2003, and that the majority of net revenue had been allocated to bus operations. It cautions that the emission gains from the scheme diminished as congestion rose again.
Where the money went
By the end of 2013 the scheme had raised about £2.6 billion in gross revenue. According to Wikipedia, about £1.2 billion of the proceeds was invested between 2003 and 2013, and £960 million of that went to buses. The spending went mostly to bus service, so the revenue funded an alternative to driving.
The Ultra Low Emission Zone
The ULEZ addresses a different problem, pollution from vehicles rather than the number of vehicles. Wikipedia describes its stages:
| Date | Step |
|---|---|
| 2017 | Toxicity charge (“T-charge”) introduced |
| 8 April 2019 | ULEZ begins in central London |
| 25 October 2021 | Extended to inner London |
| 29 August 2023 | Extended to all 32 boroughs, over 1,500 square kilometers and about 9 million people |
The charge is £12.50 a day, in force 24 hours a day, for vehicles that do not meet the emissions standard. According to the article, compliance after the 2021 extension went from 87 percent to 92 percent within a month, and nitrogen oxide in inner London was 20 percent lower after six months.
The air quality results
The article cites the first-year result, nitrogen dioxide down 12 percent, and a drop in nitrogen oxide emissions of 13,500 tonnes between 2019 and 2022. A 2025 TfL and Greater London Authority report goes further. It finds NO2 levels across London 27 percent lower in 2024 than they would have been without the zone, and 54 percent lower in central London. The comparison is a model-based estimate against a “no ULEZ” scenario and not a direct measurement of the same air, so the percentages should be read as estimates of the policy’s effect.
The GLA’s one-year report on the London-wide zone adds detail by area. Its press release gives NO2 reductions against a no-ULEZ scenario of 54 percent in central London, 29 percent in inner London and 24 percent in outer London, for 27 percent across the city. It estimates PM2.5 exhaust emissions 31 percent lower in outer London, and NOx emissions from cars and vans 14 percent lower there. The GLA also reports that 96.7 percent of vehicles seen driving in London were ULEZ compliant, up from 91.6 percent in June 2023 and 39 percent in February 2017, and that non-compliant vehicles detected on an average day fell by nearly 100,000 (58 percent) between June 2023 and September 2024. It notes that air quality improved at 99 percent of the 92 monitoring sites analyzed between 2019 and 2024, and that the analysis was reviewed by an independent advisory group.
A later GLA release, citing Defra data, says London met the legal annual mean NO2 limit of 40 micrograms per cubic meter for the first time in 2024, with a highest official reading of 36. It lists three monitoring sites that exceeded the limit (Brixton Road, Loampit Vale and Euston Road) but were excluded from the formal assessment, and it credits the Mayor’s policies, so it is an interested source.
The ULEZ also raised revenue, about £224 million in 2022 according to the article, though revenue was not its stated purpose.
The politics
The 2023 expansion was contested. The article records that a court challenge failed on 28 July 2023 and that, since 2023, vandals known as “Blade Runners” have been damaging cameras. These events show the policy was not simply accepted. Whether the scheme would work in an American city depends on factors the sources do not address, such as the density of public transport and the structure of local government.
Lessons, with caveats
Three things can be said from the evidence. First, the charge was followed by a large early reduction in chargeable traffic, with most of the diverted trips moving to public transport. Second, an emissions-based charge was followed by high compliance within weeks of an expansion. Third, the later results are less clear: speeds have kept falling and causation is not established. Measures that change traffic are one piece of the urban response to heat and pollution discussed in can we engineer our way out of a heatwave?.
What this note leaves out
This note does not compare London with American cities in numbers, since the sources cited give no US data. It does not report health outcomes, such as effects on asthma or mortality, nor the cost of the schemes to households and businesses, or how they were distributed by income. It also omits the details of exemptions and discounts, and the legal basis of the charging powers. The TfL figures come from the sixth annual report; the early-year figures in the summary and the revenue numbers come from English Wikipedia and were not checked against TfL’s earlier reports. The ULEZ press releases are published by the Mayor’s office, which has a stake in presenting the results favorably, although the underlying analysis was reviewed by independent experts.
What remains open
The sharpest open question is causation. Wikipedia itself warns that falling traffic volumes do not prove the congestion charge was the reason, and the air quality figures rest on a counterfactual estimate. The longer the policies run, the harder it becomes to separate their effect from other changes in transport, vehicles and the economy.
About the image
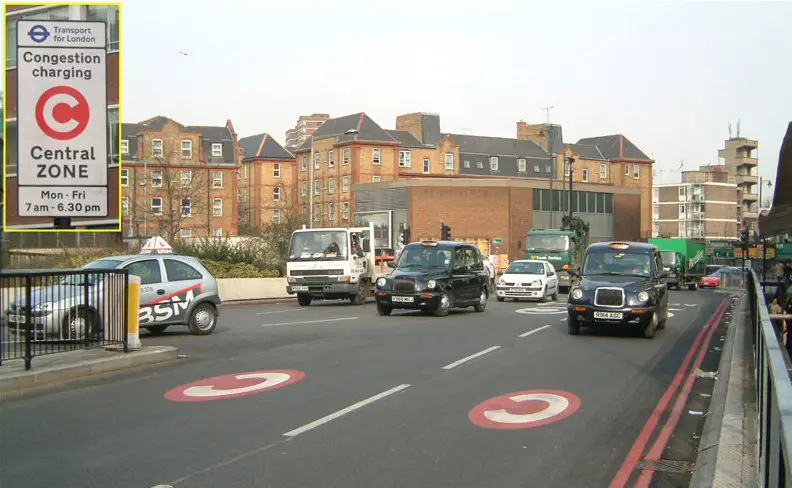
The image shows a London congestion charge sign on Old Street, one of the markers at the edge of the charging zone. It was chosen because the sign is the everyday face of the policy described above.
Frequently asked questions
How much does the London congestion charge cost?
It was £15 as of 2025 and £18 from 2 January 2026, according to Wikipedia. It applies in a central zone that has about 136,000 residents.
Did the congestion charge reduce traffic?
Traffic volumes fell by about 10 percent and vehicle-kilometers by 11 percent between 2000 and 2012, but Wikipedia cautions that this does not prove causation. Journey times fell 14 percent in the early years, though speeds have fallen again since.
What is the ULEZ and how much is the charge?
The Ultra Low Emission Zone charges vehicles that do not meet emission standards £12.50 a day, around the clock. It began on 8 April 2019 in central London and was extended to inner London in 2021 and to all boroughs in 2023.
Has the ULEZ cleaned the air?
A 2025 Transport for London and Greater London Authority report found NO2 levels 27 percent lower across London in 2024 than they would have been without the zone. Nitrogen oxide emissions fell by 13,500 tonnes between 2019 and 2022.
Did congestion in central London stay lower after the charge?
Not fully. TfL's sixth annual monitoring report (July 2008) found that congestion in the original zone in 2007 was effectively identical to the 2002 level, after reductions of about 30 percent in the first years. TfL attributed this mainly to reduced effective road capacity rather than to more traffic.
Sources and open data
- London congestion charge, English Wikipedia
- Ultra Low Emission Zone, English Wikipedia
- Central London Congestion Charging Impacts Monitoring, Sixth Annual Report (July 2008), Transport for London
- New evidence reveals that all Londoners are now breathing cleaner air following the first year of the expanded ULEZ, Greater London Authority
- London meets legal limits for toxic NO2 pollution for the first time, Greater London Authority