Solar and Wind
Australia’s six States and two Territories have always had primary responsibility for implementing policies on the transition away from fossil fuels to renewables as an energy source.& & As a result, there has been a significant increase in the number of solar and wind farm applications which have been approved.& & Indeed, it is predicted that if the rate of those approvals were sustained, it could see Australia generate over 50% of its national electricity needs from& renewables sources by 2025, making it a world leader in this field. &
Meanwhile, the Federal Government &- a coalition of the National Party (mostly climate change deniers), and Liberal Party, (with a deeply conservative right wing) are torn between a fervent desire to see domestic use of coal fired generation expanded, meeting their commitments under the Paris Accord to reduce emissions and maintaining electricity delivery to consumers at reduced cost.& & How they expect to achieve reduced cost when new coal-fired electricity is far more expensive than renewable energy is not explained.& & Nor is the fact that Australia’s& emissions are expected to rise -& despite Federal payments to emitters& costing taxpayers $2.3 billion& aimed at reducing them.
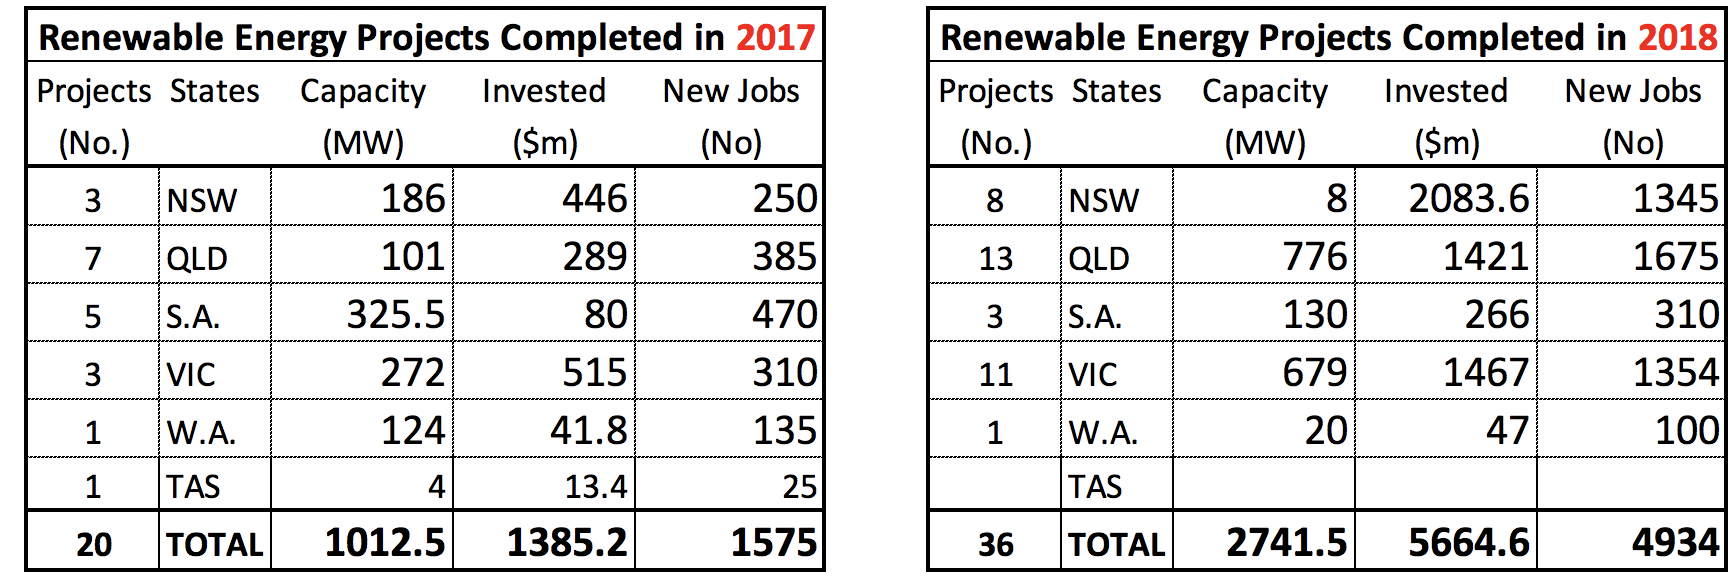
For their part, State Governments have been approving proposals of investors in solar and wind power so as to ensure a smooth transition from aging coal fired power generators to new, clean, solar and wind farm generators.& & The level of investment in grid-scale renewable generators in 2017 reached $1.385 billion spent on completion and commissioning 20 projects comprising 6 wind and 7 solar farms, 1 hybrid, 1 hydro and 4 bioenergy schemes - and the world's largest grid scale battery.& & Combined, these projects have capacity to generate 1,013 MW and created an estimated& 1,500 jobs during construction.
State Governments have approved 36 additional renewable energy projects on which construction is scheduled to complete in 2018.& & These projects, involving investment of $5.664 billion are& expected to have created an estimated& 4,900 jobs during construction, mostly& in rural areas where employment opportunities are often low.& When commissioned, these projects will have capacity to generate about 2,742 MW and providing increased competition among renewable energy generators.

Fig. 1& Distribution of projects completed and commissioned in 2017 and 2018.& Note the surge of& activity& in 2018 completions in New South Wales, Queensland and Victoria. & Source: Data published by the& Clean Energy Council& and other sources.
It should come as no surprise to learn that Queensland &- aptly named 'The Sunshine State' &- leads the nation in the number (32) and capacity (3.6 GW) of new grid-scale solar farms approved for building in 2018.& & The largest,& Kidston Solar, has back-up in the form of pumped hydro (250 MW) but few other projects have storage.& & At present, coal-fired power stations provide most of the back-up but as these reach the end of their commercial life and cease operating, solar farms will either rely on widely dispersed wind farms to provide back-up or will install& battery storage& or pumped hydro to do so.
Grid-scale batteries, like the one at& Hornsdale Power Reserve& in South Australia, re-charge from electricity when it is most plentiful and so at its cheapest, generated by hydro, wind when it blows or the sun when it shines &- which invariably occurs somewhere in Australia.& & Batteries respond to changes in the Grid in milliseconds ensuring its stability and continuity of electricity supply.
These arrangements mean that renewable and coal fired generators will be able to supply the grid with energy 24/7 with available back-up and do so more cheaply than can fossil fuelled generators alone.& & They will be able to continue doing so even when all fossil-fuelled generators have closed, as they inevitably will, either because they are too expensive to maintain or because electricity produced by solar and wind is so much cheaper. &
New Investment
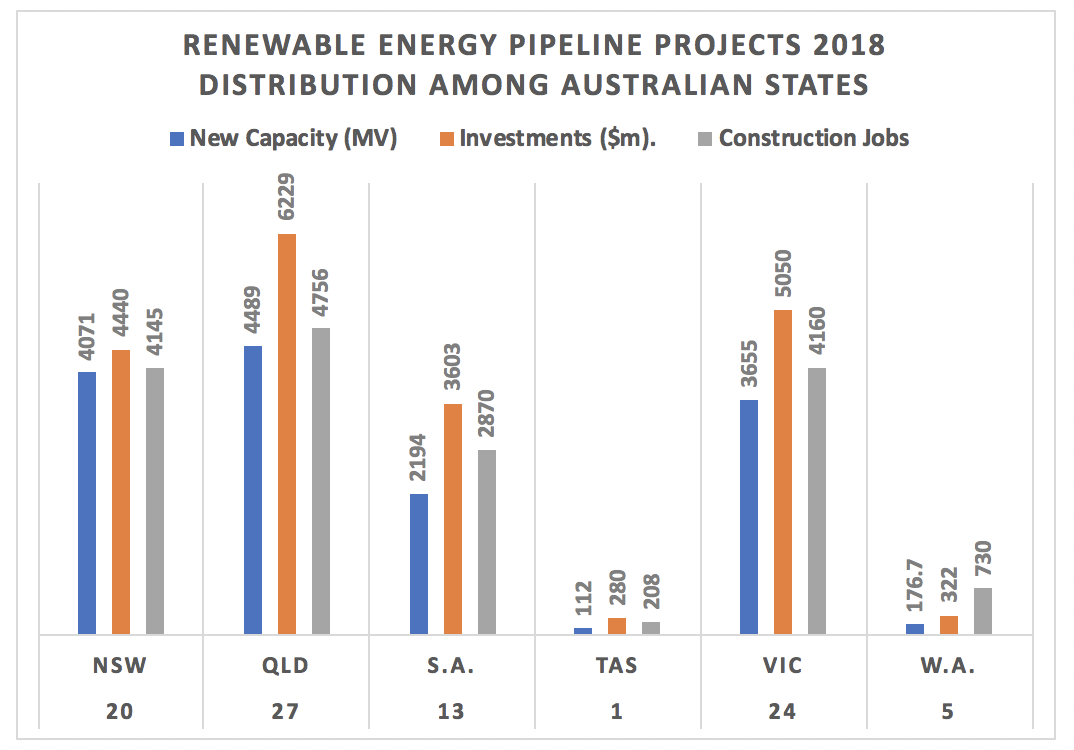
A Pipeline of 90& new renewable energy projects have been approved by State Governments. It presently comprises 56 solar, 20& wind and 14 other projects including 12 storage projects with 1,200 MW capacity.& & During construction, these projects are expected to create in excess of 16,800 jobs.& & They have an estimated investment value of $19.9& billion and capacity to generate in excess of 14,700 MW.
Many of these projects are expected to complete in 2019, indicating extraordinary exponential growth.& As shown below, Queensland& has attracted the largest new investment, $6.229 billion to be invested in 27 new projects. Victoria& attracted the second largest investment ($5.050 billion) for construction of 11 solar farms, 11& wind projects and 2 storage facilities. &
Not included in NSW estimated investment ($4.440 billion) is a multi billion& investment& for development of a 4GW energy hub& in the New England Region since a& firm proposal has yet to be put to Government.

Fig. 2& & Distribution of if an estimated 90 Pipeline projects, many of which are likely to complete in 2019.& & New projects are being continuously added to the Pipeline.& & Source: Internet Search and Proponents advice.
An odd feature of Pipeline analysis is that the Northern Territory (N.T.) does not appear to have attracted any grid-scale projects, despite its topography which favours location of both solar and wind generators.& & Further, the N.T. boasts many remote communities, most of them relying on diesel generators or roof top solar panels to provide & their& electricity needs.& & It is likely that these will be replaced by renewable energy generators feeding into local grids in coming years.
Low new investment in Tasmania is explained by the fact that the State is already& 93% self sufficient& in electricity generated from renewables, mostly hydro& & It plans to be fully self-sufficient by 2022. &
Relatively low investment in renewables in Western Australia arises from the fact that 25 gas fired power stations with 4,000 MW capacity supply the Regions, using gas produced in that State while 4 coal-fired stations supply the Capital and larger centres.& & Investment in renewable energy projects will increase as demand increases and renewable generation becomes cheaper than gas.& & Future developments may include a massive 9 GW, $20 billion& Asian Renewable Energy Hub& proposed for building in the Pilbara.
Most renewable energy projects are located in close proximity to the National Grid for ease of connection and to the Local Grid serving nearby cities and towns in which electricity consumers reside, enabling electricity to be fed into either grid in the event of damage to one of them.& & The mix of solar, wind and hybrid (with storage) is expected to enable the National Grid operator& (AEMO)& to purchase sufficient electricity to meet fluctuating demand and maintain grid stability, even in an El Nino year (2019) when prolonged heatwaves are expected and could threaten blackouts during periods of peak heat.
All States &- except Western Australia &- are connected to the National Grid and to each other by high voltage interconnectors.& & Each State seeks to be self-sufficient in renewable generating capacity so as to be unaffected by closure of fossil fuelled generators and have surplus energy to:
(a) ensure continuity of supply by ensuring that generators have capacity to supply the grid&
(b) maintain competition and put downward pressure on price of electricity and&
(c) attract new investment into a large market as it expands.
At present,& most electricity (83%)& is generated in power houses burning fossil fuels, mostly coal.& & They are much more expensive to operate than renewable generators.& This is because coal fired generators must pay - and recover - higher capital building costs (new supercritical coal fired generators are as much as x5 more expensive& & and take longer to build than renewable generators of the same capacity.& & They pay higher operating costs which include the cost of coal, increasing maintenance costs and a sizeable workforce.& By contrast, renewable generators get their fuel (wind and sunlight) free, have very low maintenance costs and need a comparatively small workforce to operate.
Australia has& 21 coal fired power stations& with 25,400 MW capacity.& & Investment in renewable energy projects since 2017 and in the Pipeline already provides capacity to generate in excess of 18,450 MW or 75% of existing coal fired capacity.& & This makes it possible that by 2025 future investment in cheaper, more efficient renewable energy generators could see the demise of all remaining coal-fired power stations and possibly the end of coal use in Australia.& & Demand for electricity in Australia will then be met from gas-fired power stations and renewable energy generators.
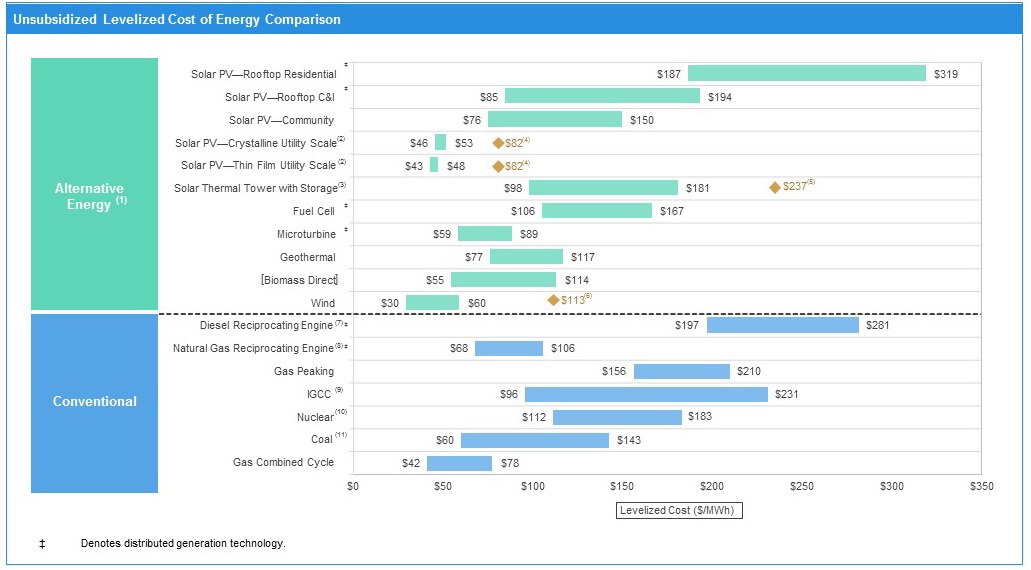
Seventy-six Thermal and Turbine Gas-fired power stations operating in the States have capacity to& generate 16,000 MW& of the electricity generated in Australia and it is possible that more may be built &- though that entails a commercial risk.& & As shown in Fig. 3 the levelized cost of electricity& generated by gas is cheaper than that generated by solar, though the difference in cost is closing.& & Electricity generated by wind is already cheaper than gas and it is likely that improvements in solar technology could see gradual closure of most if not all gas-fired power stations, possibly by 2030.&

Fig. 3& & Levalized cost of electricity generated by renewable sources and fossil fuels.& & Source:& Lazards LCOE 11.
Further reductions in the cost of electricity could result from research and development of more efficient photovoltaics, transmission lines and grid design.& & Most panels used in a solar farm array have an average& efficiency of 18%.& & In other words, over 80% of the sunlight falling on a solar panel is not converted into electricity.& & However, advances in technology continue to be made resulting in the achievement of& efficiencies as high as 38%. & &
These advances have yet to be commercialised but it is likely that the best of them will be over the next 5-10 years, making it possible to generate the same amount of electricity from 50% fewer solar panels.& & It is also possible that new technology will make it cheaper and more efficient to generate electricity - from photovoltaic cells in film applied to a wide variety of surfaces such as glass, roofing and other materials and that this technology could eventually replace solar panels.
Solar Farms already produce electricity at a levelized cost of& less than $50/MWh, below the cost of coal, which generates electricity for around $60/MWh.& & However, the cost of generating electricity using combined cycle gas remains cheaper than the cost of grid scale solar though, as shown in Fig 3, more expensive than wind energy.& & None of the fossil fuels can generate electricity as cheaply as wind and& solar is now approaching parity with wind.
Problems?
In its rush to renewables, Australia could be creating a significant waste disposal problem &- what to do with millions of PV solar panels when they reach the end of their life?
Present technology requires an average of 3,250 solar panels to produce capacity of 1 MW.& & Since January 2017, solar farm proponents have installed or intends installing solar panels with capacity of 7,700 MW or about 25 million photvoltaic solar panels, with a life of 20-25 years.& & At the end of their life these panels and those installed in the future must be removed and replaced with the latest technology available.
All State Governments need to consider appropriate legislation to provide for orderly recovery and disposal of many millions of solar panels in an eco-friendly manner.& & Who will be responsible for paying for retrieval and recycling of this material &- or that used for wind turbines made obsolete by advances in technology?& & There are going to be a lot solar panels, possibly over 100 million spread over the countryside by 2025.
To facilitate future clean-up, it is desirable that each State maintain a Register of all renewable energy assets with a capacity of over 1 MW.& & It is not clear that all States do so&
Summary
- & & & & & In 2018, Australia has attracted $19.924 billion of new investment for 90 solar, wind and storage projects with capacity to generate 14.7 GW.
- & & & & & Renewable energy projects commissioned in 2017 and 2018, plus Pipeline projects have capacity to generate 18.450 GW which is 75% of remaining coal fired capacity.
- & & & & & Most (75%) coal fired power stations& are operating beyond their commercial life& and it is likely they could close by 2025.
- & & & & & Larger businesses, including& smelting,& horticulture& and& mining& have begun installing their own renewable energy generating capacity or are signing supply contracts with renewable generators.
- & & Over two million& domestic dwellings are now fitted with roof-top solar panels with capacity to generate& some 7.8 GW.
- & & & & & Gas fired power stations with capacity to generate 16& GW could close by 2030 since cost of solar generation is likely to& achieve parity with gas& by 2020.
- & & & & & Additional investment in grid-scale renewable energy and storage is needed to provide energy security and meet increased demand caused by future economic expansion and transport electrification - likely to& begin in earnest by 2023.
Australia is moving in the right direction but, like other greenhouse gas emitters, is not reducing its emissions rapidly enough to limit global warming to 1.5°C above pre-industrial average global temperature by 2100.& & More needs to be done and done more rapidly - particularly in the electrification of transport.
Comments